Transatlantic Policy | Democratic Resilience | Quantitative Analysis
Projects
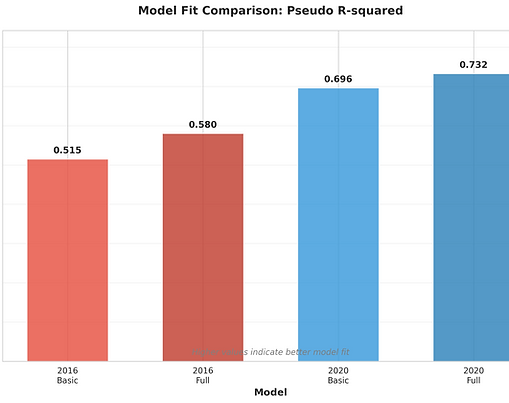
Economic Perceptions and Immigration Attitudes: Electoral Outcomes 2016-2020
Quantitative analysis using logistic regression on American National Election Studies (ANES) data covering 6,173 voter responses across 2016 and 2020 presidential elections. Models achieved McFadden's R² of 0.73, revealing an 11.62-point coefficient reversal in how economic perceptions affected Trump support, while immigration attitudes intensified 44% as a stable predictor (all p<.001).

Multilateral Sanctions Effectiveness
Quantitative analysis using difference-in-differences estimation on 180 monthly trade observations (2020-2024) and 1,764 daily financial indicators to measure the comparative effectiveness of EU multilateral versus US unilateral sanctions on Russia. EU sanctions produced 2.93x larger impact (β=-5.5, p<0.001) compared to US sanctions (β=-1.9, p=0.033), demonstrating measurable coordination advantages while revealing 66% circumvention through third-party trade diversion.

